01
Score by consumer unit
Each consumer unit receives a probability of irregularity, recalculated as new metering data arrives. No static list and no fixed rule.
Solution in development · ANEEL R&D Program
The Hopfy platform is part of an initiative developed by HopAI in institutional partnership with Cemig, within Inova Cemig.Lab and ANEEL's R&D Program. It reads the metering history your utility already holds, assigns each consumer unit a probability of irregularity, and returns a prioritized inspection queue with the rationale for every indication. Fewer blind visits. More focus for field teams.
The Hopfy platform is part of an initiative developed by HopAI in institutional partnership with Cemig, within Inova Cemig.Lab and ANEEL's R&D Program.
Inspection queue
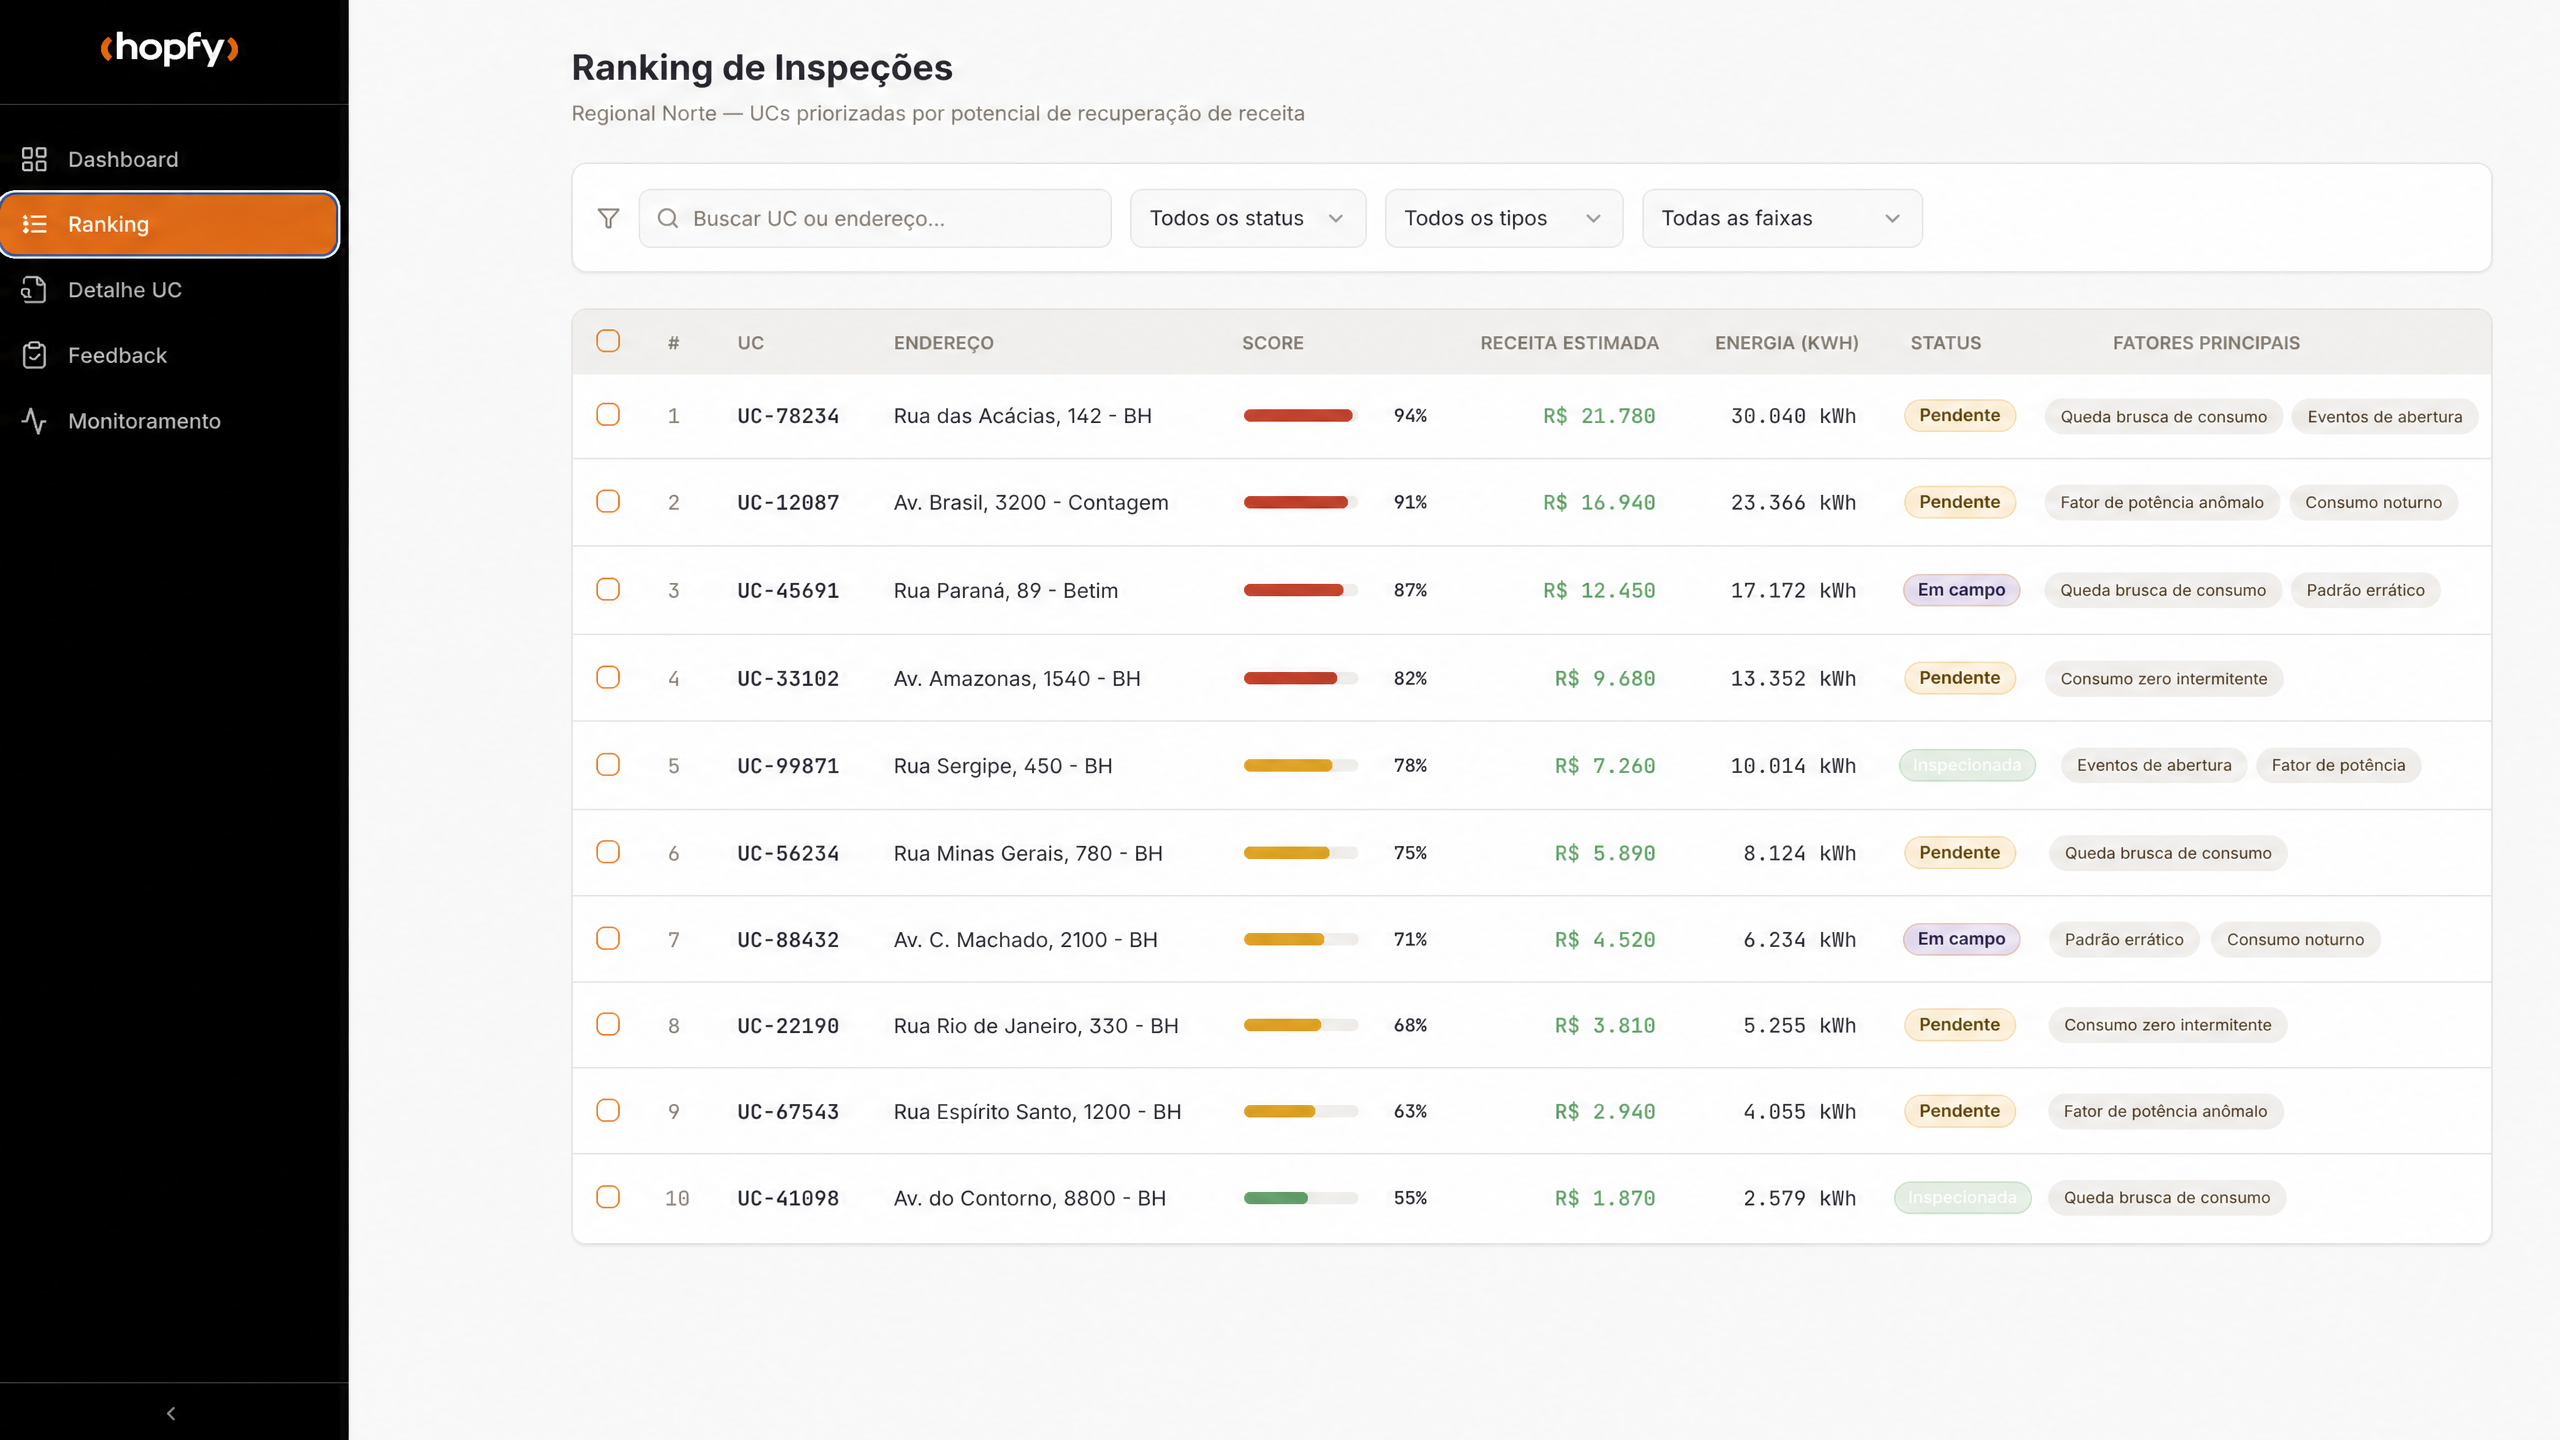
Illustrative. Fictional data. It does not represent utilities' operational information.
Project developed through an institutional partnership


ANEEL R&D Project code: PD-04950-0662/2023
The scale of the issue
Technical loss is inherent to the grid. Non-technical loss arises when consumption is not properly measured or billed. This behavior leaves signals in metering history and operational events.
14.3%
of energy injected into the distribution system became loss in 2025
45.0 TWh
was the volume of non-technical losses recorded in the year
R$ 7.9 bn
is the approximate cost of regulatory non-technical losses in 2025
76.2%
of the country's non-technical losses are concentrated in ten utilities
Source: ANEEL, energy losses report in the distribution system, base year 2025.
Hopfy platform
The bottleneck is not a lack of suspicion. It is a lack of order. The Hopfy platform is part of an initiative developed by HopAI in institutional partnership with Cemig, within Inova Cemig.Lab and ANEEL's R&D Program. It organizes indications into a queue, with priority, reason, and inspection history.
01
Each consumer unit receives a probability of irregularity, recalculated as new metering data arrives. No static list and no fixed rule.
02
The field team receives a ranking ordered by priority, configurable for the actual inspection capacity available that week.
03
Every indication is accompanied by its supporting rationale. This favors internal analysis, responses to questions, and regulatory governance.
How it works
Metering history, commercial records, events, and the results of inspections your utility has already carried out.
Each unit's consumption is compared with its own past and with similar units in the same region.
The result is a probability per consumer unit and an ordered queue sized for available inspection capacity.
Each inspection result goes back into the process. Confirmed and unconfirmed indications feed the next queue, which improves with use.
What operations see
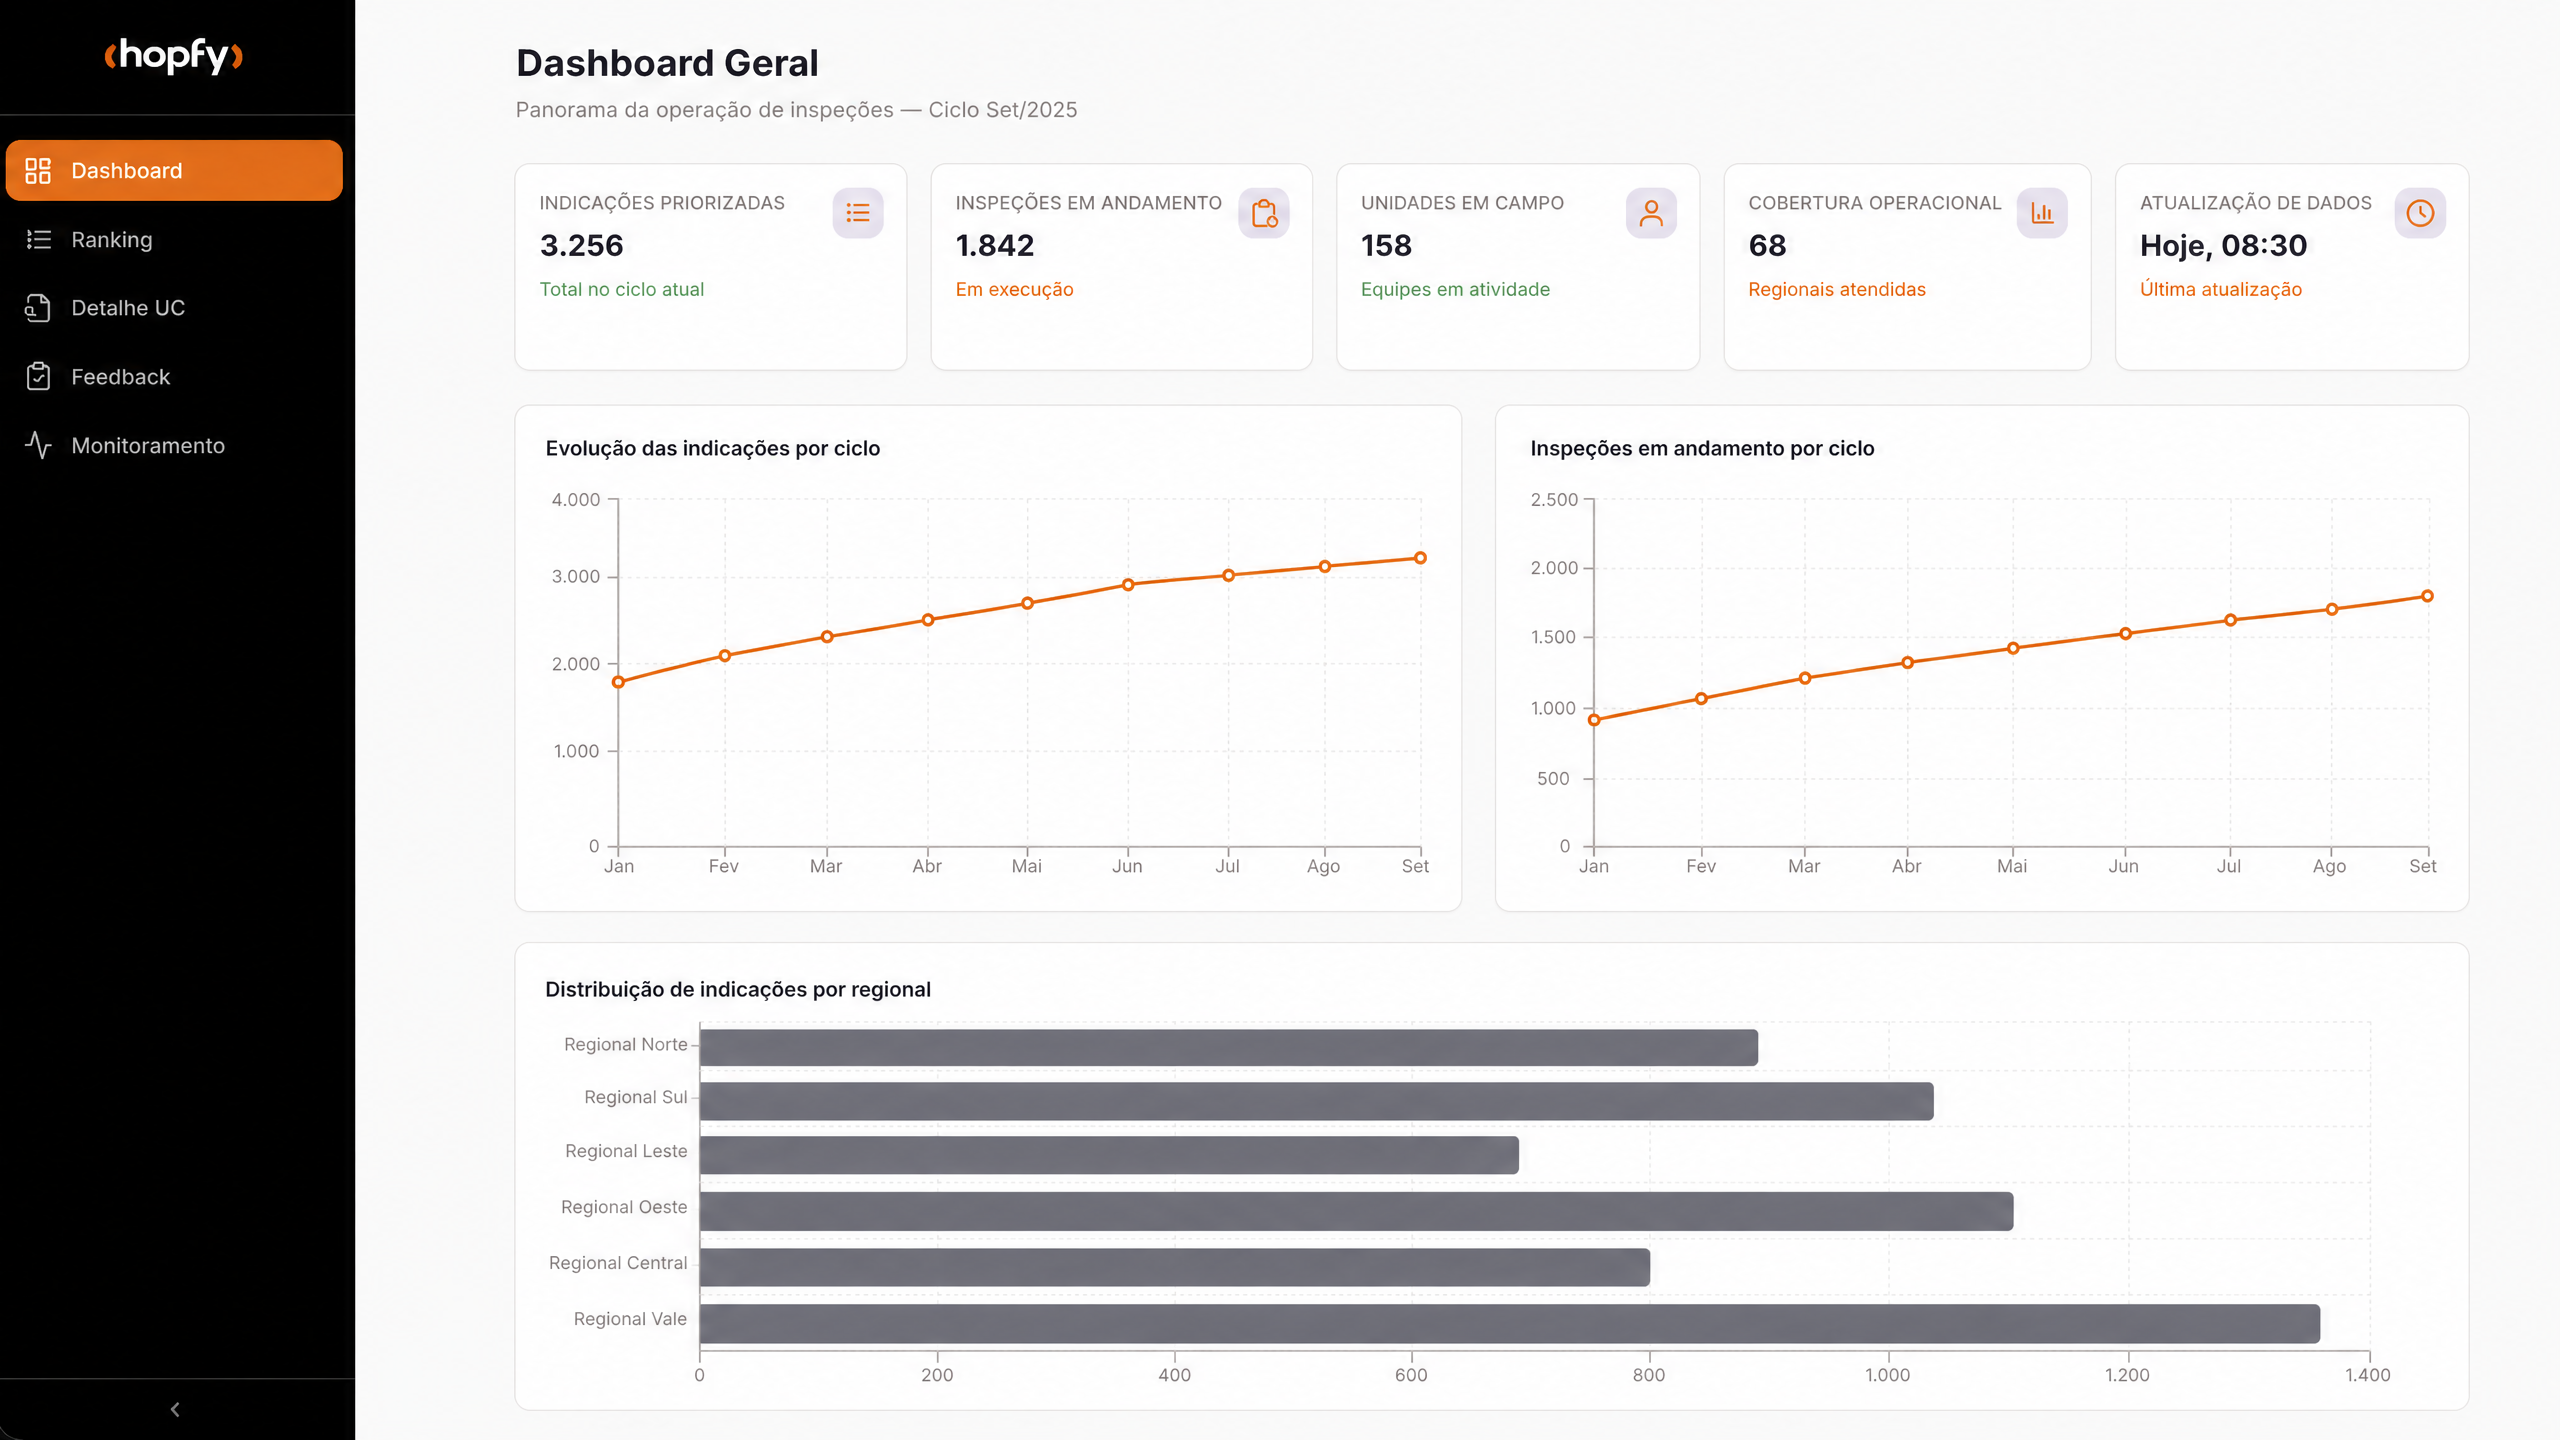 Screen 01
A consolidated view of the portfolio, estimated recovery, and operational coverage by cycle.
Screen 02A prioritized queue of consumer units, with filters that support field-routine organization.
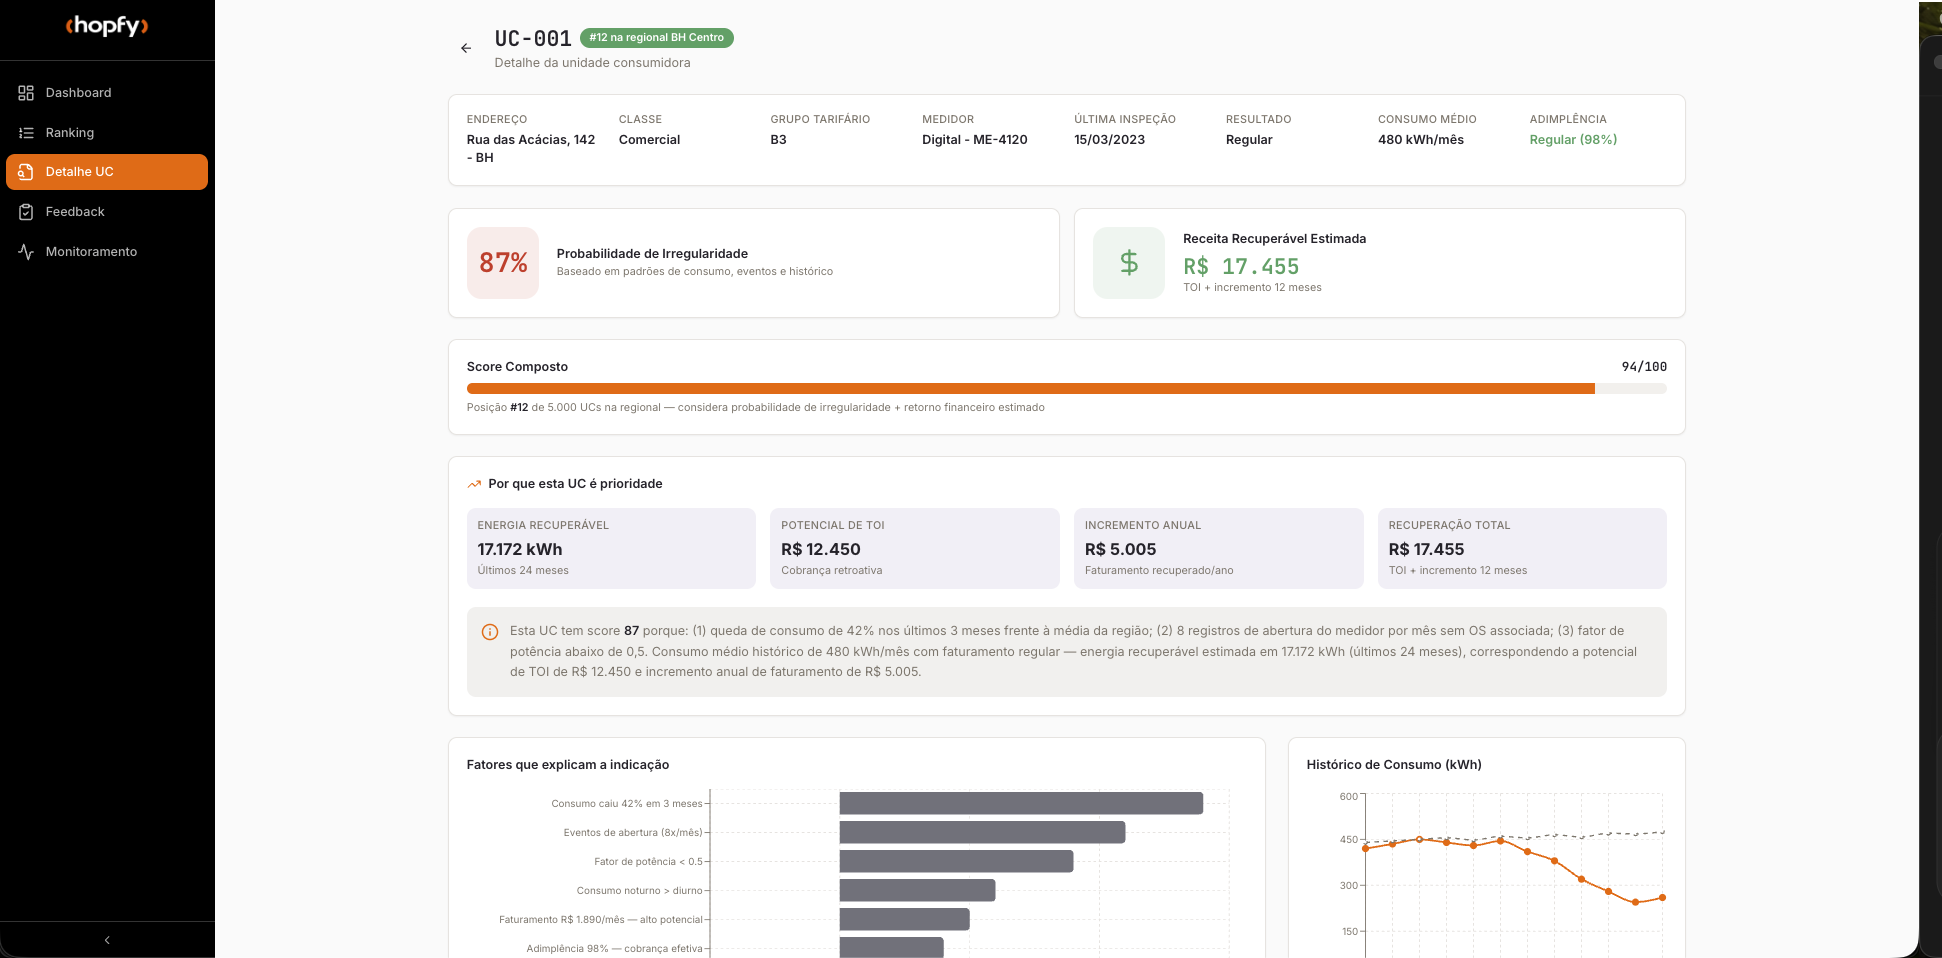 Screen 03
Context for the indication, consumption history, and factors that help guide the team's analysis.
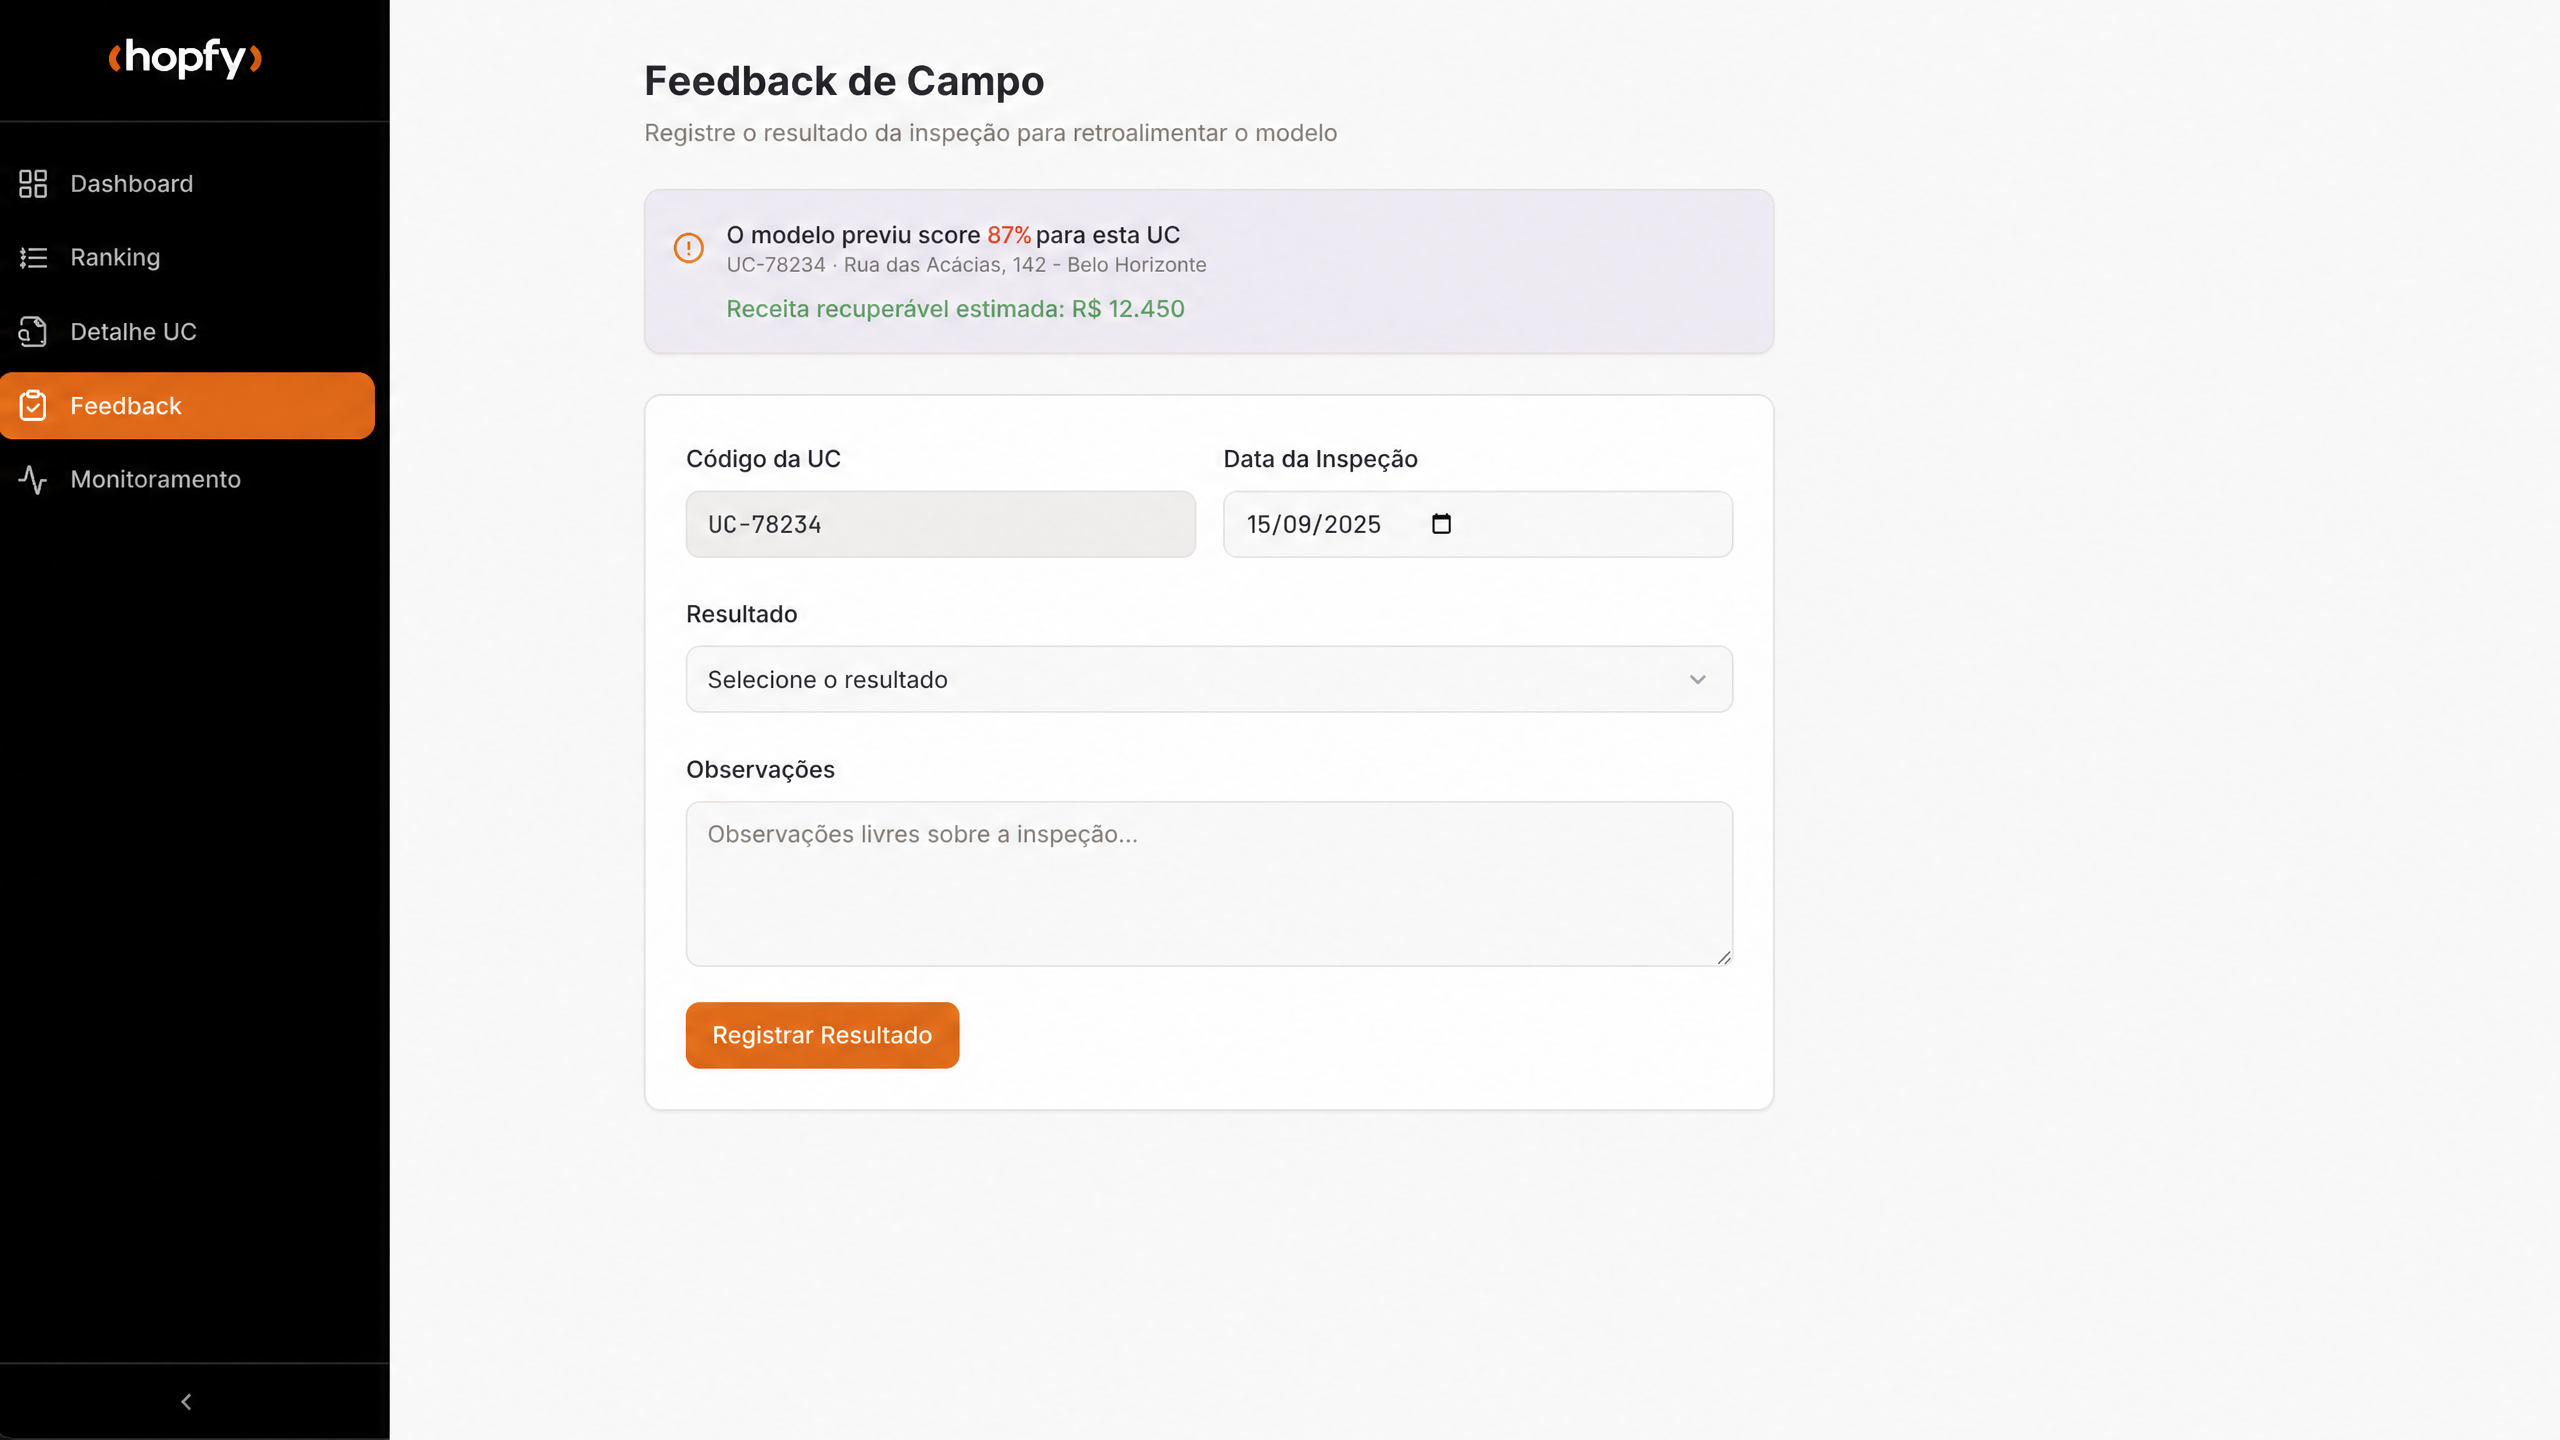 Screen 04
Inspection outcome records that support operational traceability and the solution's evolution.
Illustrative. Fictional data. It does not represent utilities' operational information.
For your utility
Every concession area has its own socioeconomic profile, grid, and consumption behavior. The Hopfy platform is part of an initiative developed by HopAI in institutional partnership with Cemig, within Inova Cemig.Lab and ANEEL's R&D Program. It is not an off-the-shelf model that gets installed; it is a method retrained on your history.
The sequence of data, score, ranking, and explainability is the same. What changes is the data that feeds it.
The solution learns from the utility's own local metering and inspection history.
The variables, temporal validation, calibration, and monitoring foundation is configured for each new context.
The queue fits into the existing inspection workflow without requiring replacement of the field system.
Transparency about the stage
The Hopfy platform is part of an initiative developed by HopAI in institutional partnership with Cemig, within Inova Cemig.Lab and ANEEL's R&D Program.
The project with Cemig progresses through proof of concept, pilot, and rollout phases over twelve months. Nothing on this page should be read as a finished product, audited result, or operational data from any utility.
Who builds it
We are a Brazilian applied AI consultancy. We put models into production inside complex operations, in environments where errors can mean downtime, fines, or lost revenue.
The Hopfy platform is part of an initiative developed by HopAI in institutional partnership with Cemig, within Inova Cemig.Lab and ANEEL's R&D Program. The initiative brings that experience together to create a solution for the specific needs of electric utilities.
First place worldwide at the IBM Beacon Award for cloud artificial intelligence.
9 years
of continuous operation in AI applied to industry, energy, mining, and services
800+
models delivered into production
R$ 1 bn+
in measurable economic impact generated for clients
Cemig, Vallourec, Usiminas, Anglo American, Stellantis, Azul, STIHL, Tigre, Unimed Brasil, and Softplan.
Next step
A one-hour conversation with HopAI's technical team. We leave it with an honest assessment of what your data can support today.
A diagnosis of what your metering base already allows us to model
A reading of potential team gains, with transparent assumptions
A proof-of-concept design with defined timing and success criteria
No field-system replacement and no dependence on a meter supplier
Talk to us
Tell us about your network, field team, or inspection process. Our team will get in touch to understand your utility's context.